AMM’s Fourth Quarter Client Letter:
Everyone knows that you should not put all of your eggs in one basket; it’s a basic tenet of investing. No investment advisor or finance professional will tell you not to diversify your wealth. Diversification is often considered the “easy” part of investing—i.e. “just put your money in several different asset classes, and you’ve reduced risk”. But, like most things related to investing, this concept is not so easy in practice. We believe that the biggest challenge with diversification is that its payoff is not in higher returns when times are good but in reduced risk when times are bad. The logical investor might ask, “why diversify into bonds or alternative assets when the S&P 500 is generating double digit gains each year?” In short, the psychological problem with diversification away from stocks is that it is not as rewarding as the S&P 500 in bull markets, and it never feels good to think that you may be missing out.
A secondary challenge is that even when diversification is working for you, your returns may seem modest, which does not feel all that satisfying. This is a classic emotional investing trap. It does not feel good to buy when markets are down and you have unrealized losses. But, it is exactly when markets are down that you have the best opportunity to improve your long-term returns by buying low. Likewise, it does not feel good to lag the market when it is going up, but the diversification built into this kind of portfolio is what will help protect you when markets decline.
To this end, it is important to remember that investing is not about immediate gratification. In fact, the most basic definition of investing is to forego consumption today in order to have the ability to consume more at a later date. To do this successfully, you have to have the wherewithal to stick with your strategy through good and bad markets. Diversification is one of the best tools to help you achieve this objective. Exhibit A below shows the trajectory of three simple portfolios from the stock market’s prior peak in 2007 through 2017. The sources cited have compared a non-diversified 100% stock portfolio (represented by the S&P 500), a moderately diversified portfolio composed of 60% stocks/40% bonds, and a conservatively diversified portfolio composed of 40% stocks/60% bonds. The results may surprise anyone who thinks they need to match or exceed the historical returns of the S&P 500.
Exhibit A
The conservative portfolio was a huge relative winner during the financial crisis years, dropping less than 20% and taking a little more than 2 years to get back to even. Compare this to the 100% stock portfolio which dropped more than 50% and took nearly 4 ½ years to get back to even. Of course, losing 20% and waiting two years to break even wasn’t a “feel good” experience. But, just like Aesop’s timeless fable about a fast moving hare who ridicules the slow moving tortoise, he inevitably learns a most valuable lesson, “slow and steady wins the race.”
The purported benefit of being invested in a pure stock market index is the potential for higher returns. But, over the cycle that began with the prior market peak in 2007, these benefits were not realized until late 2016 when the S&P portfolio finally broke away from the diversified portfolios. We are not arguing that pure stock portfolios won’t perform well over the very long run – they should indeed, since investors are generally compensated for the greater risks and volatili-ty of owning more stocks than bonds. However, investors in a pure stock portfolio must be willing to accept the full brunt of any bear market. As Wall Street Journal columnist Jason Zweig recently tweeted: “From Sept 12, 2008 to yesterday the S&P 500 is up 185.9%, or 11.08% annualized. Your money nearly tripled in 10 years. From Sept. 12, 2008 to March 9, 2009 the S&P 500 lost almost half your money in 6 months. You can’t have one without the other.”
Winning by Losing Less
There are two general ways to potentially “beat the market”: 1) Buy stocks that go up more than the market. This of-ten requires buying volatile stocks that have more market risk – i.e. they go up more when the market is going up, but lose more when the market declines; or 2) Build a portfolio that goes up less than the market in bull markets but loses less during bear markets. Option 1 may work well from time to time, but it carries greater downside risk. Option 2 builds in more downside risk protection, but it is boring and psychologically challenging since an investor in this strate-gy never feels like they are “keeping up with the market”. In other words, with a diversified portfolio, when markets go up, investors feel like they are “lagging.” And, when markets go down, investors still “lose some money.” Though nei-ther of these outcomes feels great in the short run, over-time the diversified portfolio should provide good returns with lower risk.
Exhibit B

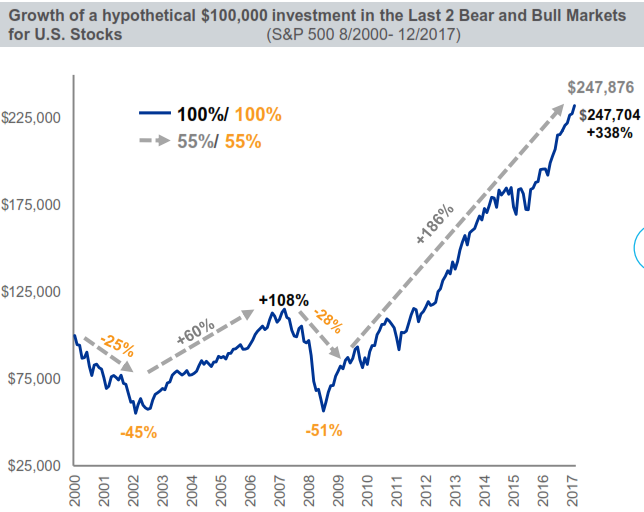
Source: Blackrock & Morningstar. Data as of 12/31/17. For illustrative purposes only. Past performance does not guarantee or indicate future results. You cannot invest directly in an index. Distributions were reinvested.
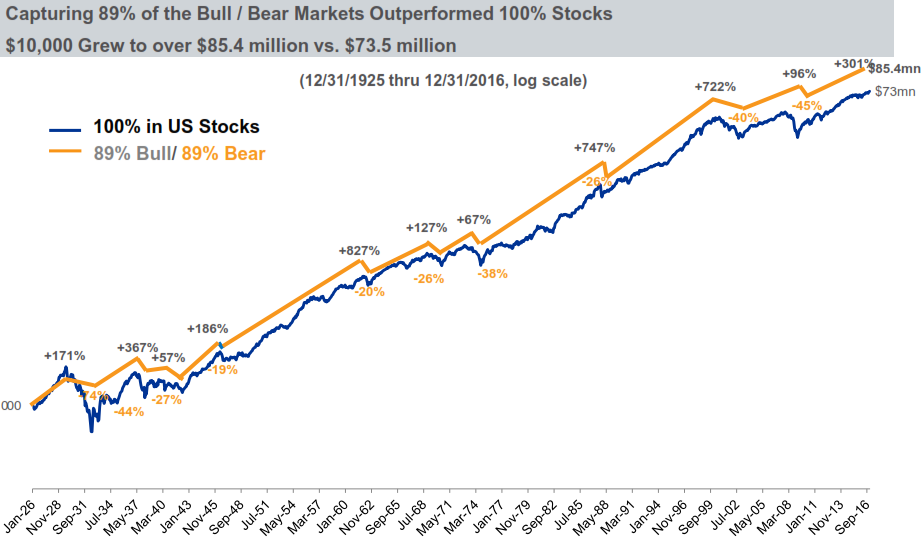
Exhibit B is a hypothetical illustration of option 2 in action since the year 2000. The solid blue line represents the S&P 500 or 100% market exposure; the grey dash line represents a portfolio that achieved only 55% of the S&P’s upside in good markets, but only suffered 55% of the S&P’s downside in bad markets (i.e. upside/downside capture ratio). The end result? The portfolio that only achieved 55% of the S&P returns in up and down markets ended up with more money. Now, this is a distinct time frame which included two very destructive bear markets with declines of -45% and -51% respectively. But even expanding the time period all the way back to 1926 (Exhibit C) shows that the optimum up-side/downside capture ratio would have been 89%. A $10,000 portfolio that generated 11% less than the market in bull markets but lost 11% less in bear markets would have ended 2016 with $12 Million more in total assets.
Exhibit C

Source: Blackrock & Morningstar. Past performance does not guarantee or indicate future results. It is not possible to invest in an index. US stocks represented by the Ibbotson SBBI US Large Cap TR Index. Index performance is for illustrative purposes only. This assumes reinvestment of capital gains and dividends. Assumes investor stays fully invested over the full period.
The lesson here is simple: you do not need to generate 100% (or more) of the market return to achieve a good return. And in some instances, you might even achieve a better return by not achieving 100% of the market return. Even if you don’t beat the market over a period of time, it does not mean that you should abandon your strategy. Full market exposure means full exposure to market risk and volatility. As Zweig noted, “you can’t have one without the other.” As your trusted advisors, we focus first on your tolerance for risk and volatility, then we build a portfolio that matches those objectives. Leave the market timing, performance chasing, and potentially wealth destroying activities to others.
Q3 2018 In Review
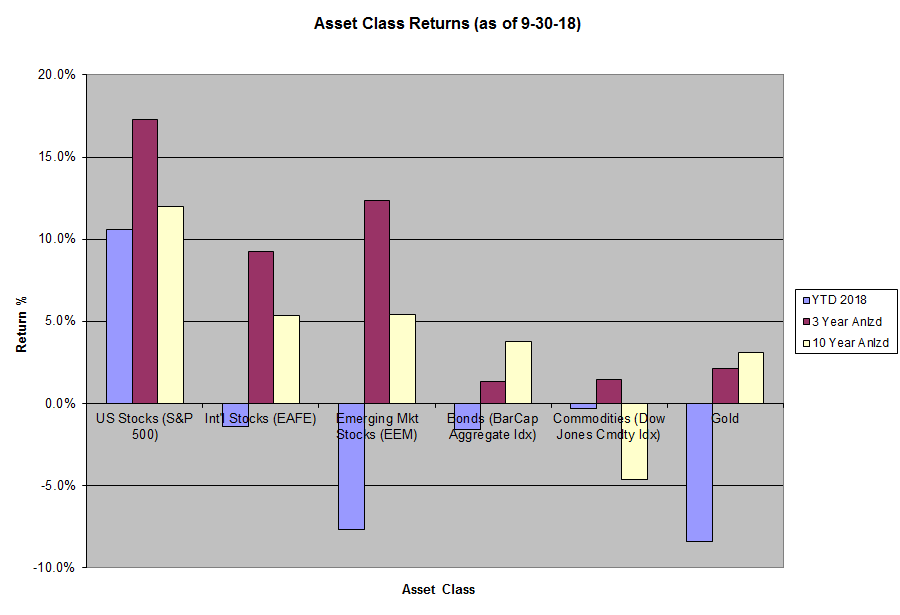
Year-to-date through 9/30/18, domestic stocks (S&P 500) were up 10.6%, developed international stocks (EAFE) declined -1.4%, and emerging market stocks (EM) declined -7.7%. Bonds (Bar Cap Agg Idx) declined -1.6%, commodities declined -0.3% and gold declined -8.4%. We have updated our asset class return chart (Exhibit D) to reflect YTD 2018 along with three and ten year annualized returns for the aforementioned asset classes.
Exhibit D
Notable in our asset class return chart is that the US is the only asset with positive YTD returns. This is quite a difference from the year ending 2017 when all asset classes produced positive returns. This has widened the valuation gap between US and international stocks, a gap that we expect to reverse at some point in the future. While we are not downright bearish on US stocks or the US economy, we are generally seeing greater value opportunities in international markets. As such, valuations in international markets continue to look more attractive relative to the US. But, headline risks related to a myriad of geopolitical issues continue to weigh on sentiment in these markets. For asset allocation portfolios, we continue to look through these issues to the longer term values currently offered by these markets.
Perhaps the big asset class story of 2018 is the move in bond prices. In response to rising interest rates, bonds have been selling off for most of the year, with the Barclays’s aggregate index putting up the first negative return since 2013 and, as of this writing, the worst return since 1994 when the index was down almost 3%. A few key points related to the action in bonds this year: 1) bond declines should be expected given the continued rise in interest rates, which we have been expecting for many years now; 2) while this is negative for bonds in the near-term, over time higher rates will be a net positive for conservative savers; 3) bond volatility is a fraction of stock volatility. The worst calendar year for bonds since 1980 was -3%; the worst calendar year for stocks (S&P 500) since 1980 was -38%. Bottom Line: Investors looking to abandon bonds because of recently poor returns are likely making an asset allocation error. Historically, investment grade bonds are significantly less volatile than stocks and do not have a strong correlation with stocks. This makes bonds one of the single best asset classes to diversify a stock portfolio with. At AMM, we can provide diversified portfolios of taxable and tax-free municipal bonds of varying maturities.
For our part, most of our clients’ bond positions have performed well relative to the index this year. This is in part due to our use of shorter duration/shorter maturity bond funds which tend to carry less interest rate risk. Additionally, we have incorporated unconstrained bond strategies and floating rate strategies into most client bond allocations. These strategies seek to provide absolute returns, regardless of the interest rate environment, and have been among the best performing fixed income allocations year-to-date.
Lastly, the exposure to Gold and Commodities continues to be a drag on near-term returns in asset allocation oriented portfolios. These assets are intended to act as inflation hedges and portfolio diversifiers, since they do not correlate strongly with stocks. While the inflation hedge has not been needed in recent years, with unemployment now at near generational lows, we think an uptick in inflation would be more likely than not and could ultimately provide these assets a much needed boost.
*Individual accounts will vary based on a client’s stated objectives, risk tolerance and time frame. We manage several different portfolio strategies, so not every client has exposure to the securities, asset classes or investment strategies discussed above. In addition to growth and/or income orient-ed asset allocation strategies, we also manage more concentrated equity portfolios that generally carry a higher degree of risk and volatility. Let us know if you want to discuss your specific portfolio strategy in greater detail.
Should you have any questions regarding your investment account(s) and personal financial plans, or if there have been any recent changes to your investment and/or retirement objectives, please do not hesitate to contact our office to speak with one of us at your convenience. We can also provide you with a current copy of our SEC Form ADV Part 2, at your request.
As always, we thank you for entrusting AMM to help you achieve your investment and retirement objectives.


